A Deep Dive Into Workers’ Comp Stats

Frank Huang, Head of Property & Casualty Actuarial Solutions
March 5th 2020
Originally published in PEO Insider (March 2020)
Reproduced with permission of the National Association of Professional Employer Organizations
Over the past decade, the workers’ compensation (WC) industry experienced the quintessential highs and lows of a market cycle. The goal of this article is to share and discuss recent trends in both the WC and PEO WC space sand provide thoughts on the direction of the market over the next year. We will wrap up the article by sharing some ideas that PEO leadership and risk management professionals can consider to prepare themselves for the more challenging times that will inevitably come.
Trends to Date: Entire WC Industry
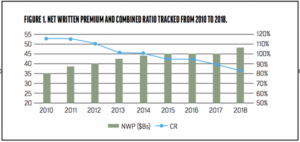
The broader WC industry has experienced some of its highest levels of profitability in recent history, especially compared to how the decade began. Calendar year (CY) 2010 saw the lowest net written premium (NWP) and highest combined ratio (CR) in the last nine years. Both metrics have steadily improved in the years that followed, leading to a projected CY 2018 NWP that increased almost 40 percent and a projected CY 2018 CR that is more than 30 points lower than 2010. NWP includes both National Council on Compensation Insurance (NCCI) states and state insurance funds such as California and Texas. Combined ratios are only for private carriers. This data is from NCCI’s 2019 State of the Line Presentation. See Figure 1.
Underlying frequency and severity trends for indemnity claims also continue the same trajectory since 2010, with severity increasing an average of 2 percent annually through 2018, but frequency driving the overall high-level favorable trends with an average annual decrease of almost 4 percent. See Figure 2.
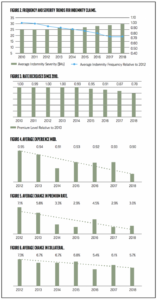
All of this has led to numerous rate decreases since 2010, with 2018 rates projected to be 22 percent less than they were in 2010, as shown in Figure 3.
Trends to Date: PEO WC Industry
Just as the broader industry is growing in scale and profit, similar favorable trends can be seen in the PEO WC space, according to NAPEO’s 2019 Financial Ratio & Operating Statistics (FROS) survey. The average experience mod, average change in premium rate, and average change in required collateral all decreased over the past seven years. More specifically the FROS survey showed, from 2012 to 2018:
- The average experience mod decreased from 0.95 (2012) to 0.90 (2018), as shown in Figure 4;
- The average change in premium rate decreased from 7.1 to 3.0 percent, as shown in Figure 5; and
- The average change in collateral decreased from 7.3 to 5.7 percent, as shown in Figure 6.
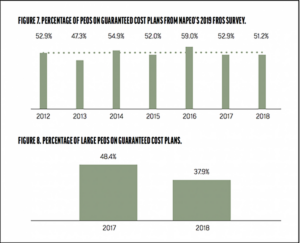
Despite the attractiveness of strong recent profitability, the percentage of PEOs on guaranteed cost plans has remained relatively flat across all members that participated in the FROS survey, as shown in Figure 7.
It is worth noting that the FROS survey reflects mostly PEOs with fewer than 5,000 worksite employees (WSEs). For PEOs with more than 5,000 WSEs, the percentage of PEOs using guaranteed cost plans has actually decreased by more than 10 percent.
FIGURE 8. PERCENTAGE OF LARGE PEOS ON GUARANTEED COST PLANS.
Preparing for Rough Waters
While no one can predict how the macroeconomic winds will blow in 2020, conventional wisdom is that there isn’t an overwhelming number of indications pointing to a hardening market in the next 12 months. The main reason behind this expectation is that improvements in and greater adoption of technology have helped to lower indemnity claims frequency. As investment in technology is expected to continue in both the broader WC and PEO WC spaces, downward frequency trends are expected to continue, likely making for a favorable 2020 WC climate.
However, PEOs would be wise to prepare for future inclement weather. As a rising tide lifts all boats, when the tide recedes, it may reveal risk management shortcomings without adequate time to make necessary improvements.
What can PEOs do now to improve their WC programs? Examine the entire WC life cycle of prospects turned clients, and make sure there are no weak spots. More specifically, PEOs can:
- Make sure evaluation and pricing are sound, considering both actual and expected experience;
- Ensure renewal pricing meets the firm’s long-term business goals;
- Handle claims appropriately by complexity, with greater potential for savings in the most complex claims;
- Use safety consultants to drive savings and not just maintain stability; and
- Approach policy renewals and collateral negotiations with a clear understanding of the book’s risk characteristics and experience.
All of these things can be accomplished with improved practices within the organization, and also by using talent and technology from outside your organization. In fact, the PEO industry could take a page from the insurance industry’s book and learn from its use of analytics to drive favorable trends.
While the above suggestions may seem like a big ask, especially for smaller PEOs, implementing even relatively simple risk management practices might benefit your firm greatly and potentially accelerate your firm’s progress towards the future.
Take-aways
The PEO WC space has mirrored the broader WC industry over the last decade, with a favorable environment expected to continue into 2020 for both. However, the PEO industry may want to proactively consider making improvements in their businesses before these trends begin to shift. PEOs that are prepared for the future will get there in far better condition than those that aren’t.
-
February 15th 2019
A PEO’s Field of Dreams – Insurance Program Structure
Every time I attend a professional sporting event, I am always in awe…

-
January 21st 2019
Strategic Claims Management for PEOs
Underwriting and claims have a lot in common. Both are easily considered afterthoughts…

-
October 8th 2019
Show Me The Money – Turning Workers’ Comp Risk into Profits
You Really Read It It’s been a busy few months and in that…

-
May 15th 2020
COVID-19s Impact on Worker’s Compensation Costs and What PEOs Can Do
Originally published in PEO Insider (May 2020) Reproduced with permission of the National Association of…

-
October 15th 2019
The Role of AI in the PEO Industry Circa 2019
Clients and prospects often ask about the status of analytics in the PEO…

-
February 15th 2019
PEO Pricing: Strategic Pricing for Long-Term Profitability
One of the most common things a new client asks us to help…

-
February 18th 2019
Intriguing Details of PEO Industry’s Largest Public Firms
Because people have more interesting ways to spend their time than to pour…

-
October 29th 2019
Intriguing Details of the Largest Public PEOs in 2019
Because our first post was so well received, we decided to post annual updates. Below…

-
September 6th 2023
From Analysis Paralysis to AI Triumph: A Guide to Picking the Right Vendor
Originally published in Risk & Insurance (September 2023). Reproduced with permission of the publication.…

-
February 9th 2024
Navigating New Frontiers in Insurance Loss Control Surveys
The landscape of insurance Loss Control Surveys is rapidly evolving, driven by technological…

-
March 29th 2024
The Impact of AI on Insurance Underwriting
The increasing acceptance and adoption of artificial intelligence in the insurance industry promises…
-
November 16th 2022
Filling in the Data Gap
Originally published in PEO Insider (November 2022). Reproduced with permission of the National Association…

-
March 4th 2025
Approaching LTC Rate Increases with Strategy and Compassion
Long-term care (LTC) insurance policies have undergone profound shifts since they were introduced…

-
April 28th 2025
Empowering Employee Recovery: Georgia's Return-to-Work Revitalization Initiative
Workplace injuries are costly for both employees and employers. The National Safety Council…